Using the summary file of the Million Song Dataset, how can we find out the average BPM of tracks per year? (This is an IPython notebook showing how to start working with the MSD. See the original gist to download.)

First, let's import the PyTables module, then open up the file (available from http://labrosa.ee.columbia.edu/millionsong/sites/default/files/AdditionalFiles/msd_summary_file.h5).

In [1]:
import tables

h5file = tables.openFile("msd_summary_file.h5")

Let's see what the file's structure is like.

In [2]:
h5file
Out[2]:
File(filename=msd_summary_file.h5, title='H5 Song File', mode='r', rootUEP='/', filters=Filters(complevel=1, complib='zlib', shuffle=True, fletcher32=False))
/ (RootGroup) 'H5 Song File'
/analysis (Group) 'Echo Nest analysis of the song'
/analysis/songs (Table(1000000,), shuffle, zlib(1)) 'table of Echo Nest analysis for one song'
  description := {
  "analysis_sample_rate": Int32Col(shape=(), dflt=0, pos=0),
  "audio_md5": StringCol(itemsize=32, shape=(), dflt='', pos=1),
  "danceability": Float64Col(shape=(), dflt=0.0, pos=2),
  "duration": Float64Col(shape=(), dflt=0.0, pos=3),
  "end_of_fade_in": Float64Col(shape=(), dflt=0.0, pos=4),
  "energy": Float64Col(shape=(), dflt=0.0, pos=5),
  "idx_bars_confidence": Int32Col(shape=(), dflt=0, pos=6),
  "idx_bars_start": Int32Col(shape=(), dflt=0, pos=7),
  "idx_beats_confidence": Int32Col(shape=(), dflt=0, pos=8),
  "idx_beats_start": Int32Col(shape=(), dflt=0, pos=9),
  "idx_sections_confidence": Int32Col(shape=(), dflt=0, pos=10),
  "idx_sections_start": Int32Col(shape=(), dflt=0, pos=11),
  "idx_segments_confidence": Int32Col(shape=(), dflt=0, pos=12),
  "idx_segments_loudness_max": Int32Col(shape=(), dflt=0, pos=13),
  "idx_segments_loudness_max_time": Int32Col(shape=(), dflt=0, pos=14),
  "idx_segments_loudness_start": Int32Col(shape=(), dflt=0, pos=15),
  "idx_segments_pitches": Int32Col(shape=(), dflt=0, pos=16),
  "idx_segments_start": Int32Col(shape=(), dflt=0, pos=17),
  "idx_segments_timbre": Int32Col(shape=(), dflt=0, pos=18),
  "idx_tatums_confidence": Int32Col(shape=(), dflt=0, pos=19),
  "idx_tatums_start": Int32Col(shape=(), dflt=0, pos=20),
  "key": Int32Col(shape=(), dflt=0, pos=21),
  "key_confidence": Float64Col(shape=(), dflt=0.0, pos=22),
  "loudness": Float64Col(shape=(), dflt=0.0, pos=23),
  "mode": Int32Col(shape=(), dflt=0, pos=24),
  "mode_confidence": Float64Col(shape=(), dflt=0.0, pos=25),
  "start_of_fade_out": Float64Col(shape=(), dflt=0.0, pos=26),
  "tempo": Float64Col(shape=(), dflt=0.0, pos=27),
  "time_signature": Int32Col(shape=(), dflt=0, pos=28),
  "time_signature_confidence": Float64Col(shape=(), dflt=0.0, pos=29),
  "track_id": StringCol(itemsize=32, shape=(), dflt='', pos=30)}
  byteorder := 'little'
  chunkshape := (148,)
/metadata (Group) 'metadata about the song'
/metadata/songs (Table(1000000,), shuffle, zlib(1)) 'table of metadata for one song'
  description := {
  "analyzer_version": StringCol(itemsize=32, shape=(), dflt='', pos=0),
  "artist_7digitalid": Int32Col(shape=(), dflt=0, pos=1),
  "artist_familiarity": Float64Col(shape=(), dflt=0.0, pos=2),
  "artist_hotttnesss": Float64Col(shape=(), dflt=0.0, pos=3),
  "artist_id": StringCol(itemsize=32, shape=(), dflt='', pos=4),
  "artist_latitude": Float64Col(shape=(), dflt=0.0, pos=5),
  "artist_location": StringCol(itemsize=1024, shape=(), dflt='', pos=6),
  "artist_longitude": Float64Col(shape=(), dflt=0.0, pos=7),
  "artist_mbid": StringCol(itemsize=40, shape=(), dflt='', pos=8),
  "artist_name": StringCol(itemsize=1024, shape=(), dflt='', pos=9),
  "artist_playmeid": Int32Col(shape=(), dflt=0, pos=10),
  "genre": StringCol(itemsize=1024, shape=(), dflt='', pos=11),
  "idx_artist_terms": Int32Col(shape=(), dflt=0, pos=12),
  "idx_similar_artists": Int32Col(shape=(), dflt=0, pos=13),
  "release": StringCol(itemsize=1024, shape=(), dflt='', pos=14),
  "release_7digitalid": Int32Col(shape=(), dflt=0, pos=15),
  "song_hotttnesss": Float64Col(shape=(), dflt=0.0, pos=16),
  "song_id": StringCol(itemsize=32, shape=(), dflt='', pos=17),
  "title": StringCol(itemsize=1024, shape=(), dflt='', pos=18),
  "track_7digitalid": Int32Col(shape=(), dflt=0, pos=19)}
  byteorder := 'little'
  chunkshape := (12,)
/musicbrainz (Group) 'data about the song coming from MusicBrainz'
/musicbrainz/songs (Table(1000000,), shuffle, zlib(1)) 'table of data coming from MusicBrainz'
  description := {
  "idx_artist_mbtags": Int32Col(shape=(), dflt=0, pos=0),
  "year": Int32Col(shape=(), dflt=0, pos=1)}
  byteorder := 'little'
  chunkshape := (1024,)

We want to find songs in each year (/musicbrainz/songs/year) and to retrieve the BPM (/analysis/songs/tempo) for each one.

In [3]:
musicbrainz = h5file.root.musicbrainz.songs
analysis = h5file.root.analysis.songs

from collections import defaultdict
by_year = defaultdict(list)
for row1 in musicbrainz.where('year != 0'):
    row2 = analysis[row1.nrow]
    by_year[row1['year']].append(row2['tempo'])
    
In [4]:
print("Year\tAvg. BPM")
for year, values in by_year.iteritems():
    num_songs = len(values)
    print("{}\t{:0.2f} ({} songs)".format(year, float(sum(values))/num_songs, num_songs))
Year	Avg. BPM
1922	159.91 (6 songs)
1924	110.00 (5 songs)
1925	114.48 (7 songs)
1926	99.62 (19 songs)
1927	112.81 (43 songs)
1928	113.66 (52 songs)
1929	107.10 (93 songs)
1930	116.48 (40 songs)
1931	99.58 (35 songs)
1932	109.14 (11 songs)
1933	121.88 (6 songs)
1934	109.64 (29 songs)
1935	110.32 (24 songs)
1936	99.61 (25 songs)
1937	103.24 (28 songs)
1938	127.40 (19 songs)
1939	95.52 (35 songs)
1940	99.95 (52 songs)
1941	99.45 (32 songs)
1942	113.17 (24 songs)
1943	114.32 (14 songs)
1944	110.01 (15 songs)
1945	101.63 (30 songs)
1946	107.57 (29 songs)
1947	111.68 (57 songs)
1948	113.85 (43 songs)
1949	109.45 (60 songs)
1950	111.55 (84 songs)
1951	114.62 (74 songs)
1952	110.18 (77 songs)
1953	116.08 (133 songs)
1954	116.29 (123 songs)
1955	110.86 (275 songs)
1956	112.71 (565 songs)
1957	114.09 (598 songs)
1958	116.13 (583 songs)
1959	121.60 (592 songs)
1960	114.00 (424 songs)
1961	117.64 (572 songs)
1962	119.79 (605 songs)
1963	118.53 (902 songs)
1964	118.41 (945 songs)
1965	117.49 (1120 songs)
1966	119.09 (1377 songs)
1967	119.08 (1718 songs)
1968	118.71 (1867 songs)
1969	119.59 (2211 songs)
1970	122.43 (2350 songs)
1971	125.76 (2131 songs)
1972	124.86 (2288 songs)
1973	124.58 (2596 songs)
1974	125.14 (2186 songs)
1975	124.89 (2482 songs)
1976	126.31 (2179 songs)
1977	129.80 (2502 songs)
1978	128.06 (2926 songs)
1979	129.75 (3108 songs)
1980	129.24 (3101 songs)
1981	130.24 (3167 songs)
1982	129.73 (3597 songs)
1983	128.22 (3386 songs)
1984	128.22 (3368 songs)
1985	126.20 (3578 songs)
1986	126.10 (4220 songs)
1987	126.32 (5125 songs)
1988	123.77 (5613 songs)
1989	123.68 (6672 songs)
1990	123.85 (7258 songs)
1991	123.69 (8650 songs)
1992	123.53 (9547 songs)
1993	123.76 (10529 songs)
1994	125.04 (12127 songs)
1995	125.53 (13260 songs)
1996	124.86 (14135 songs)
1997	125.80 (15182 songs)
1998	125.39 (15858 songs)
1999	124.93 (18262 songs)
2000	125.31 (19293 songs)
2001	125.06 (21604 songs)
2002	124.62 (23472 songs)
2003	124.67 (27389 songs)
2004	124.61 (29618 songs)
2005	124.95 (34960 songs)
2006	124.59 (37546 songs)
2007	124.73 (39414 songs)
2008	124.83 (34770 songs)
2009	124.56 (31051 songs)
2010	125.00 (9397 songs)
2011	143.00 (1 songs)

A little sparse before 1953, but we'l take it. Now let's see what the trend is (if any).

We'll fit a LOWESS curve, then plot both it and the raw means.

In [5]:
# lowess function from https://gist.github.com/agramfort/850437
import numpy as np
from math import ceil
from scipy import linalg

def lowess(x, y, f=2./3., iter=3):
    """lowess(x, y, f=2./3., iter=3) -> yest

    Lowess smoother: Robust locally weighted regression.
    The lowess function fits a nonparametric regression curve to a scatterplot.
    The arrays x and y contain an equal number of elements; each pair
    (x[i], y[i]) defines a data point in the scatterplot. The function returns
    the estimated (smooth) values of y.

    The smoothing span is given by f. A larger value for f will result in a
    smoother curve. The number of robustifying iterations is given by iter. The
    function will run faster with a smaller number of iterations."""
    n = len(x)
    r = int(ceil(f*n))
    h = [np.sort(np.abs(x - x[i]))[r] for i in range(n)]
    w = np.clip(np.abs((x[:,None] - x[None,:]) / h), 0.0, 1.0)
    w = (1 - w**3)**3
    yest = np.zeros(n)
    delta = np.ones(n)
    for iteration in range(iter):
        for i in range(n):
            weights = delta * w[:,i]
            b = np.array([np.sum(weights*y), np.sum(weights*y*x)])
            A = np.array([[np.sum(weights), np.sum(weights*x)],
                   [np.sum(weights*x), np.sum(weights*x*x)]])
            beta = linalg.solve(A, b)
            yest[i] = beta[0] + beta[1]*x[i]

        residuals = y - yest
        s = np.median(np.abs(residuals))
        delta = np.clip(residuals / (6.0 * s), -1, 1)
        delta = (1 - delta**2)**2

    return yest
In [6]:
%matplotlib notebook
import matplotlib.pyplot as plt

x = np.arange(1950, 2010)
y = np.array([np.mean(by_year[i]) for i in x])

# need to rescale, else we get a singular matrix
scaled_x = np.arange(0,1, 1.0/len(x))
ymax = float(np.max(y))
scaled_y = y / ymax

f = 0.25 # smoothing span; larger == smoother
yest = lowess(scaled_x, scaled_y, f=f, iter=3)

yest *= ymax

plt.xlim(1950, 2010)
plt.scatter(x, y, label='y raw')
plt.plot(x, yest, label='y smoothed')
plt.xlabel('year')
plt.ylabel('Average BPM')
plt.title('BPMs over time')
Out[6]:
<matplotlib.text.Text at 0x109237ad0>

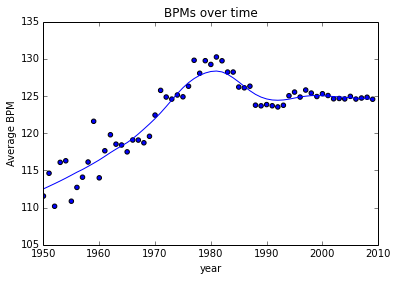
The tendency seems to have been a gradual increase since the '50s (when the data goes over 100 samples), peaking at 130 BPM in 1981 and settling around 124 BPM. Of course, these numbers should be treated with some skepticism, as 1993-2009 are significantly overrepresented in the corpus.